


Before we begin to understand about OpenTelemtry, let us try to understand what is observability.
What is Observability?
Observability lets us understand a system from the outside, by letting us ask questions about that system without knowing its inner workings. Moreover, it allows us to troubleshoot and handle problems ( the “unknown unknowns”), and helps us answer the question, “Why is this happening?”
To get all those information, the application must be properly instrumented. That is, the application code must emit signals such as traces, metrics, and logs. An application is properly instrumented when developers don’t need to add more instrumentation to troubleshoot an issue because they have all of the information they need.
What is OpenTelemetry?
OpenCensus and OpenTracing were merged to form OpenTelemetry (OTel for short) in May 2019. As a CNCF incubating project, OpenTelemetry takes the best of both worlds, and then some.
OTel’s goal is to provide a set of standardized vendor-agnostic SDKs, APIs, and tools for ingesting, transforming, and sending data to an Observability back-end (i.e. open source or commercial vendor).
In this blog let us see how we can auto-instrument a java application
Setup
Download opentelemetry-javaagent.jar from Releases of the
opentelemetry-java-instrumentationrepo. The JAR file contains the agent and instrumentation libraries.Place the JAR in your preferred directory and launch it with your app
you'd require a collector to collect the telemetry data, To create a local jaeger collector run this docker command in the terminal:
docker run -d --name jaeger \
> -e COLLECTOR_ZIPKIN_HOST_PORT=:9411 \
> -p 5775:5775/udp \
> -p 6831:6831/udp \
> -p 6832:6832/udp \
> -p 5778:5778 \
> -p 16686:16686 \
> -p 14250:14250 \
> -p 14268:14268 \
> -p 14269:14269 \
> -p 9411:9411 \
> jaegertracing/all-in-one:1.32
Once this docker image is running, the local jager collector will be available at port: 14250.
Now you can run the command: OTEL_SERVICE_NAME=my-service OTEL_TRACES_EXPORTER=jaeger OTEL_EXPORTER_JAEGER_ENDPOINT=http://localhost:14250 java -javaagent:./opentelemetry-javaagent.jar -jar target/*.jar
This will auto instrument your java application with OpenTelemetry. To test this, open your application and perform some operations. Once that is done, check the jaeger collector endpoint, you can find all the traces and spans created for different operations.
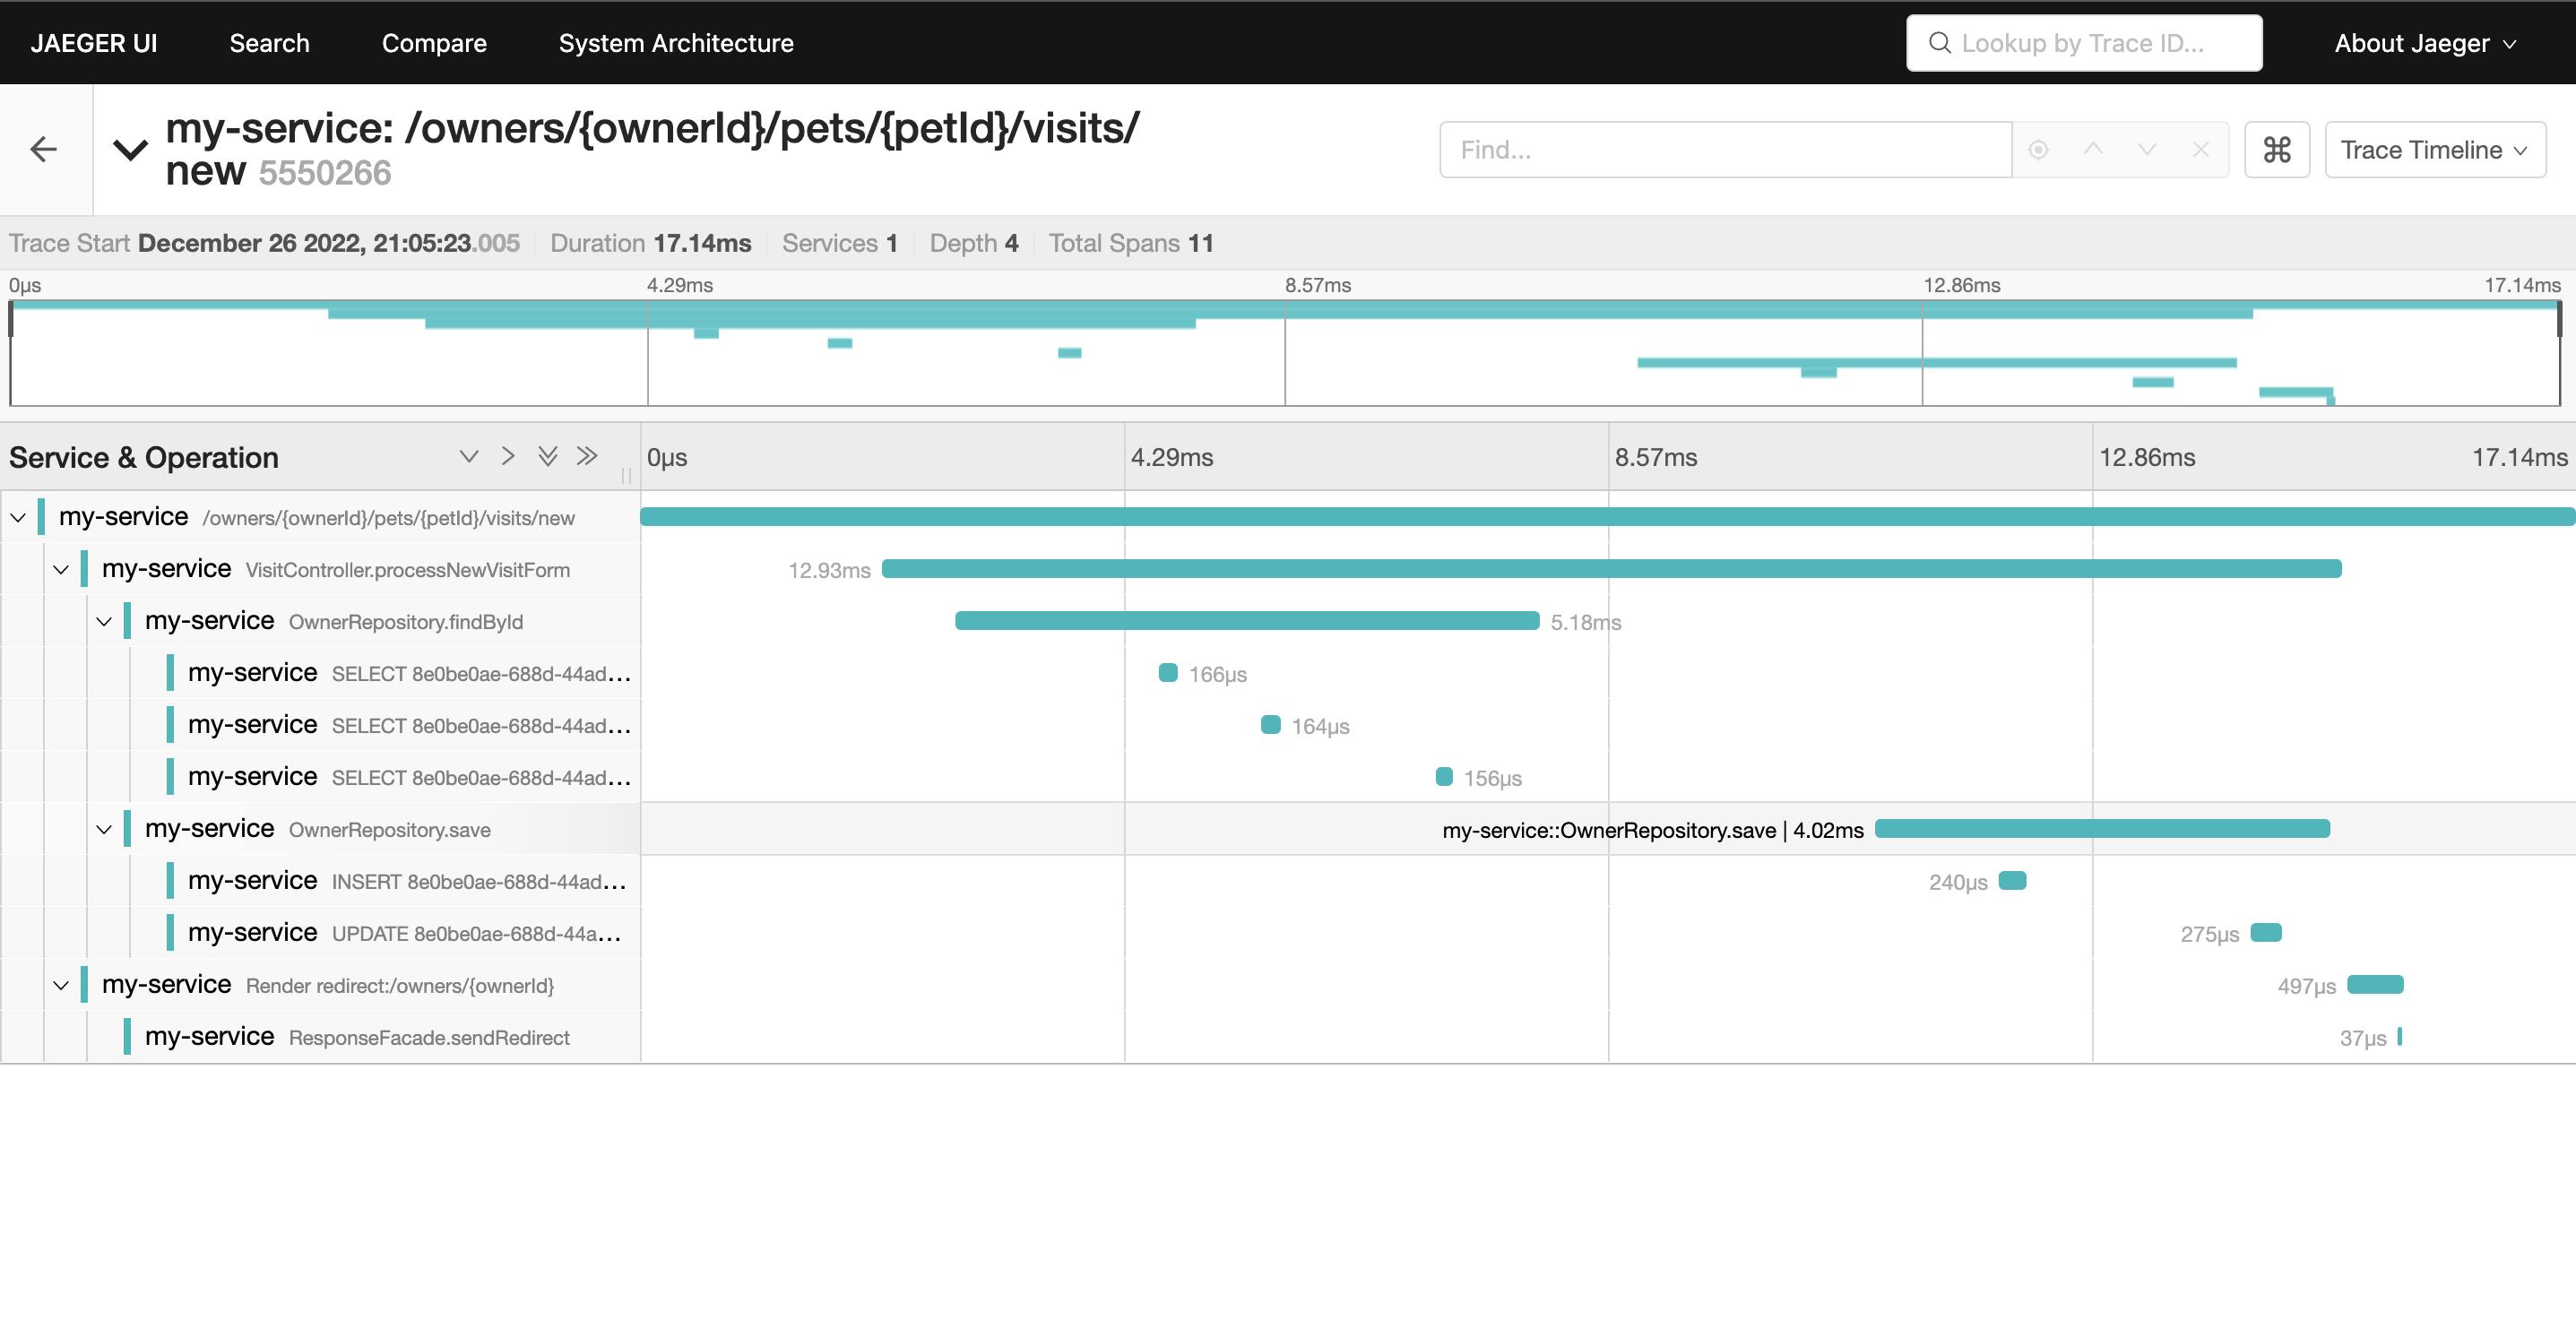
This is a quick way to auto-instrument your java application using OpenTelemetry java-agent jar.